Particle Analysis — Protein solutions characterization using CellVista SLIM
CellVista SLIM (Spatial Light Interference Microscopy) uses a new quantitative phase imaging (QPI) technique to provide fast and accurate quantitative measurements of protein particle solutions.
The CellVista SLIM system includes a widefield imaging technique that does not require biomarkers.
This results in faster, nondestructive assays for protein production, characterization and aggregation monitoring.
Segmentation and classification of silicon oil impurities is also possible.
We can produce live demonstrations for this topic, either with in-house samples or delivered samples.
Phase Imaging (QPI) for
Particle Analysis
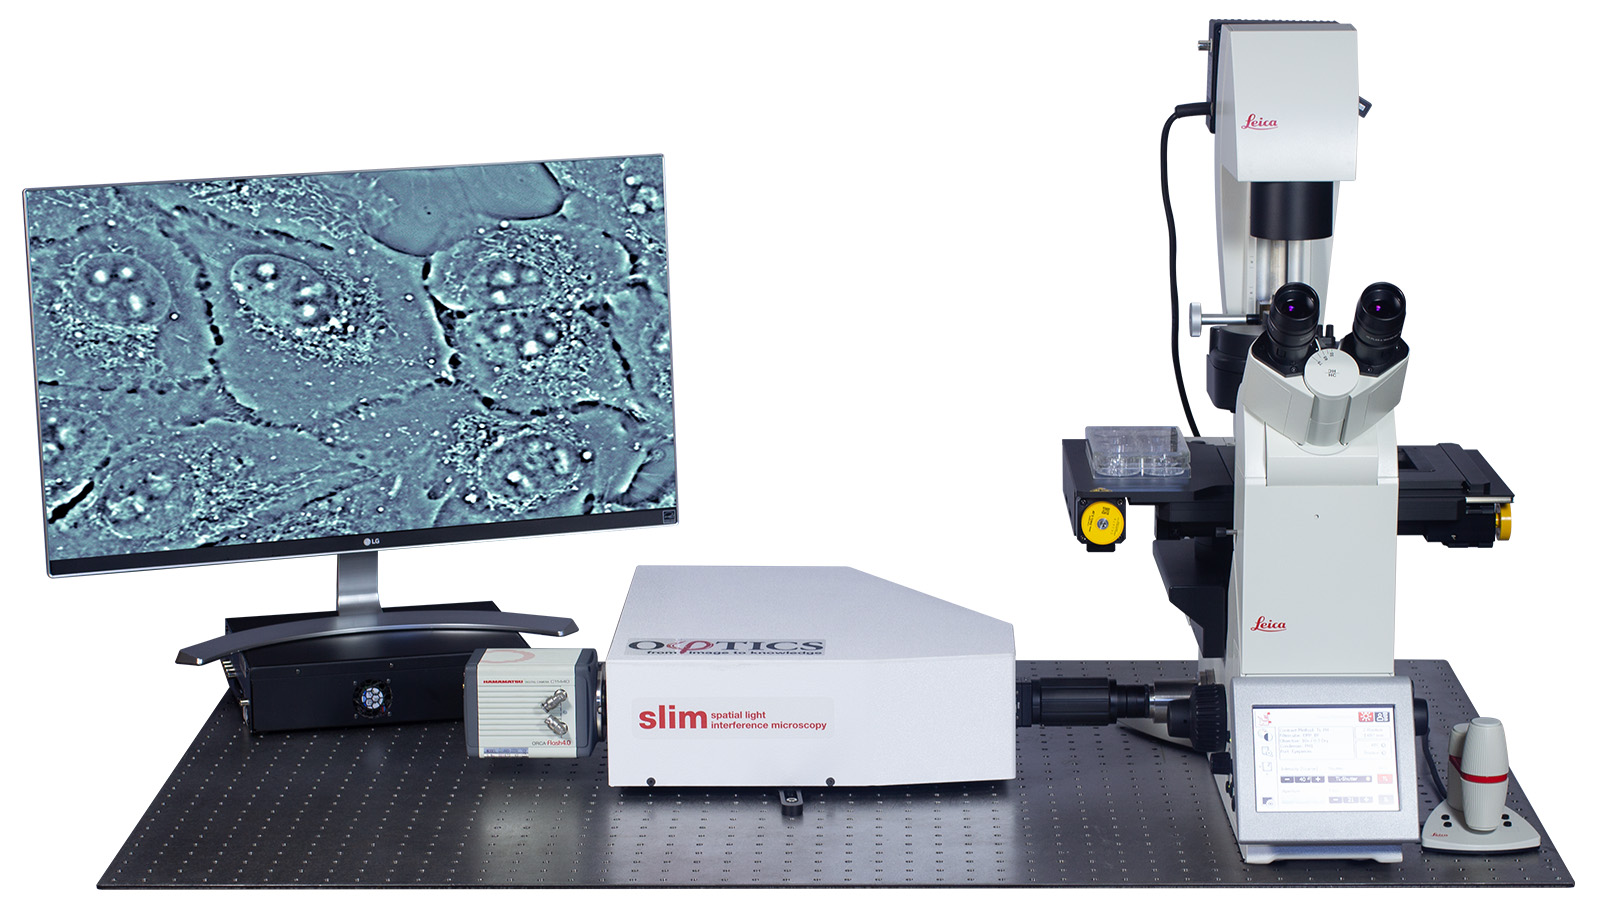
Phi Optics CellVista System seamlessly upgrades the camera port of your microscope for protein particle analysis and characterization.
Free Pre-Recorded Webinar
Register to access this free online video webinar which covers this topic in-depth.
The CellVista software interfaces directly with the microscope to control all functions. CellVista SLIM provides high contrast and quantitative data for particles as small as 10s of nanometers, with diffraction limited (submicron) resolution. 3D scanning (XYZ) of glass-bottomed, consumable cell dishes or multi-well cell plates enable high throughput (up to 100 uL/min), without cross-contamination.
It works well with cell and protein assays and can provide accurate protein solutions characterization. CellVista SLIM can monitor shape, structure and processes with nanometer sensitivity (along Z-axis), providing quantitative assessment of protein content with femtogram sensitivity. CellVista SLIM has no minimum sample size, which enables researchers to work with small batch quantities.
Samples can be imaged in consumable glass-bottomed cell dishes or multi-well plates, via direct pipetting from bioreactor, where there is no particle carry-over, no cross-contamination, no washing, and no leaking or clogging. CellVista SLIM can also be integrated in table top-instrument (using disposable flow chamber) for in-line monitoring of bioreactor cultures. A more detailed description can be found in the reference pages in the How It Works page.
Image Acquisition and Software Protein solutions characterization can be performed with the dedicated software CellVista software.
CellVista provides programmed acquisition of data for 2D (mosaicking), 3D (z-stack), and 4D imaging (3D + time series), using CellVista SLIM and any number of channels present on the microscope (e.g. fluorescence).
The resulting CellVista SLIM images can be segmented using any imaging analysis software package. The example below shows the procedure using the freely available ImageJ (NIH, DOI: 10.1038/nmeth.2089).
The measured path length information at each pixel is directly related to the dry mass density at that point, and, thus, by integrating over a Region of Interest (ROI), the total dry mass in the ROI is measured.
When translated into dry mass, CellVista SLIM’s sensitivity corresponds to changes on the order of femtograms.
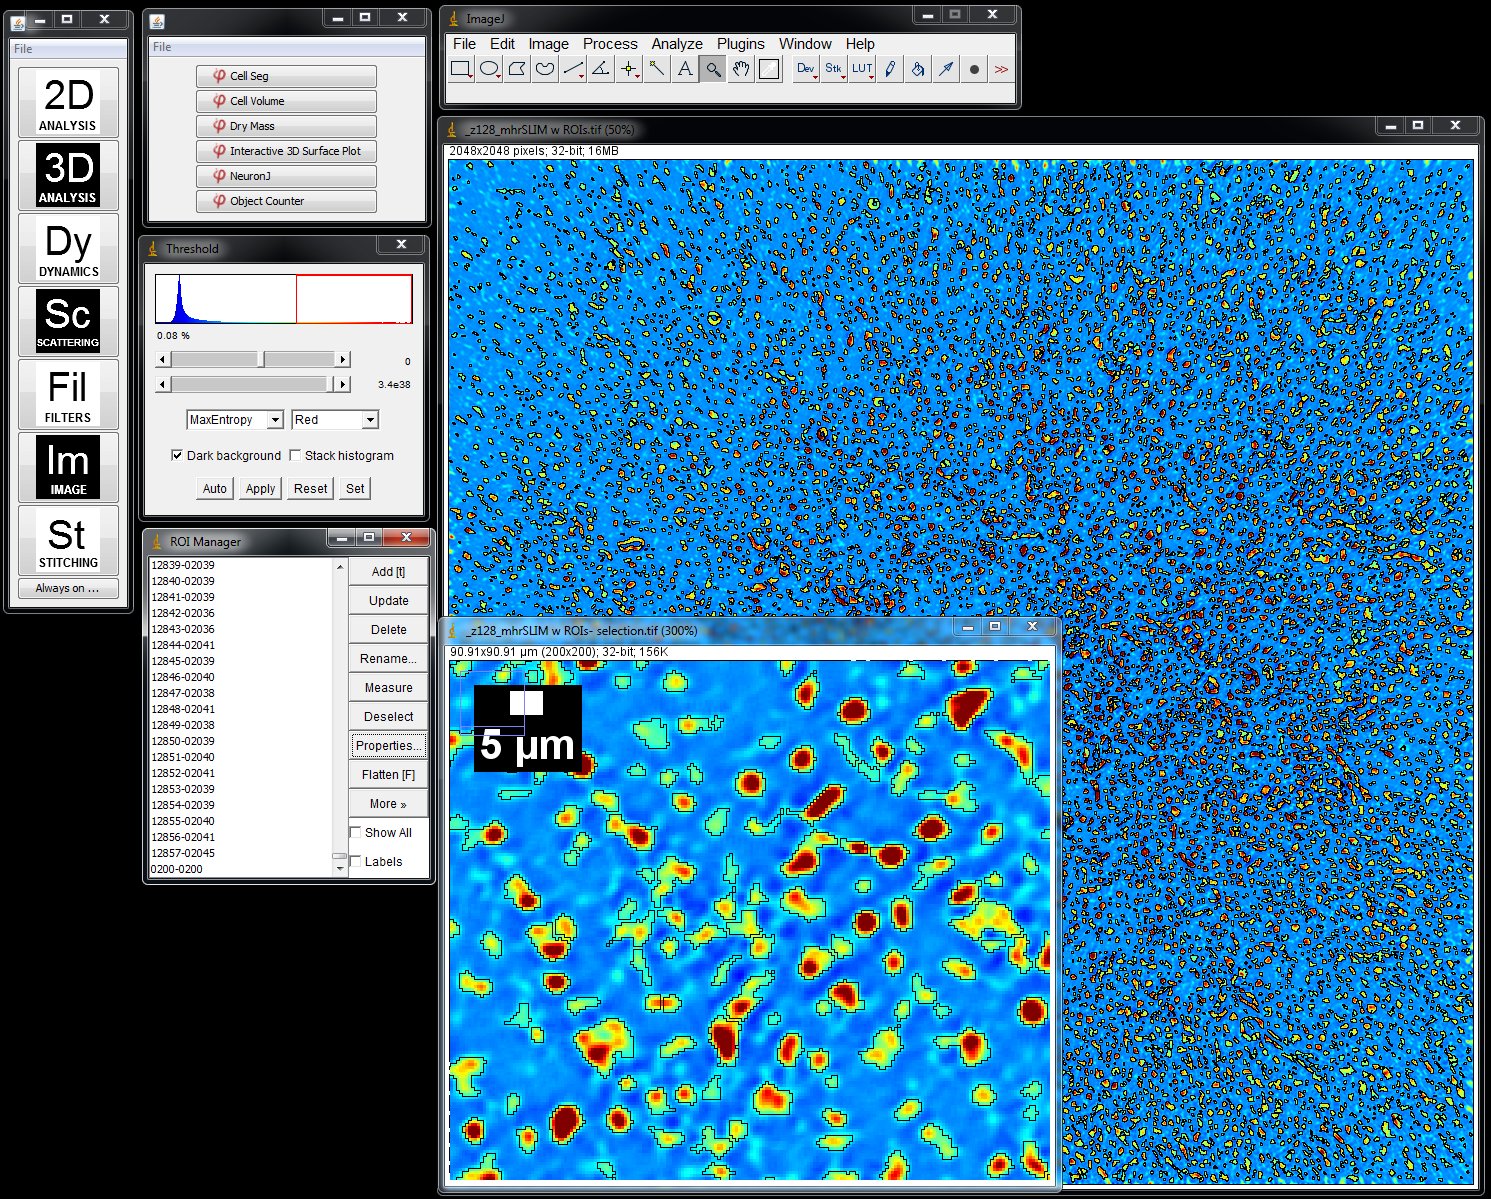

Segmentation is done via ImageJ Threshold and Particle Analyzation plugins
Protein solutions characterization
Particle counting and dry mass measurement is performed using the ImageJ plugin:
- Load a SLIM image or a time series in ImageJ. The color map is a measurement of the phase shift (optical path length difference) in every pixel. Insert is a detail of the larger SLIM map. Phi Optics plugins are conveniently loaded in ImageJ.
- Segment the image using Threshold and Analyze Particles plugins and add the profile of each particle in the field of view to the ROI manager.
- Select the Dry Mass plugin in Phi Optics 2D Analysis menu and press OK to measure the Total Dry Mass for each ROI loaded in the ROI manager. See Figure 2.
- For each frame, the morphology (area, Feret diameter, height, equivalent spherical diameter – ESD ) and total dry mass for each particle is displayed in a separate column and can be saved into an Excel file for further analysis. See the Protein Analysis Report Figure below.
Metrics
CellVista SLIM system capabilities include live segmentation, particle counting, 3D volume morphology and tracking, protein content (picograms), and refractive index ID.
The reporting is Excel based: Cell density, cell viability, and protein content. The data are repeatable, sample invariant and suitable for machine learning applications.
Quantification reports are available for an individual particle or an entire population (Particle size 0.01 – 100 microns). Instruments are capable of measuring high density with high throughput (Particle count 6 x 10^10 particles/mL.)
Fiqure on right: Protein Analysis reporting based on particle mass, shape and 3D volume are available.

For high image resolution solutions of thick specimens, please see our CellVista GLIM™ systems. For customization don’t hesitate to CONTACT US!