2D Cell Assays using CellVista SLIM
Spatial Light Interference Microscopy is used to measure the dry mass of many individual adherent cells in various conditions, over spatial scales from micrometers to millimeters, temporal scales ranging from seconds to days, and cell types ranging from bacteria to mammalian cells conditions required for a label-free proliferation assays and growth.
Combining CellVista SLIM with fluorescence imaging provides a unique method for studying cell cycle-dependent growth: the fluorescent reporter indicates the cell growth stage and SLIM provides non-invasive measurements of cell dry mass with single cell resolution (femtogram sensitivity).
We can produce live demonstrations for this topic, either with in-house samples or delivered samples.
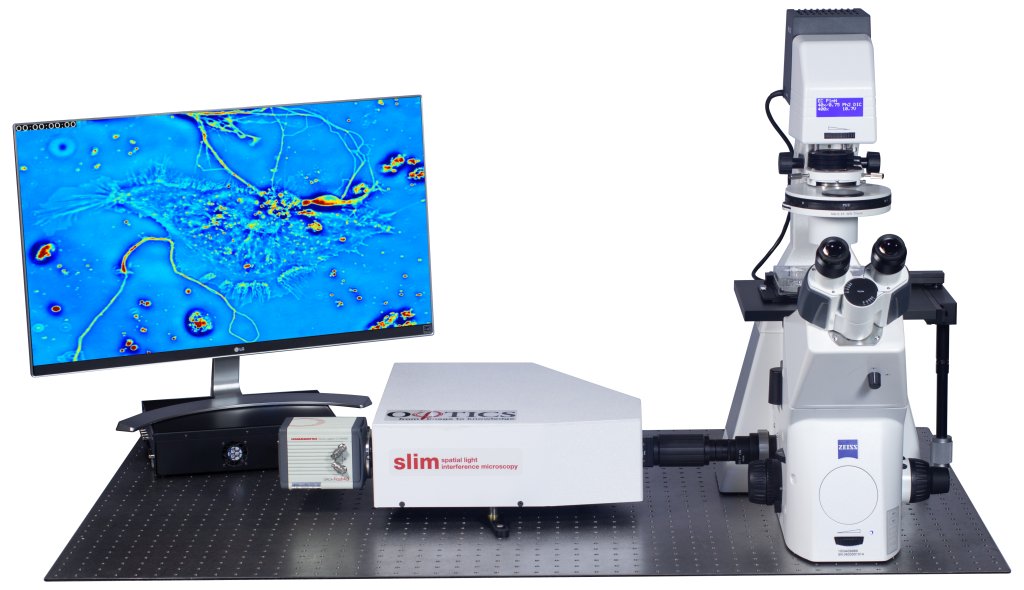
Phi Optics CellVista System seamlessly upgrades the camera port of microscope for studying Cell Growth.
Free Pre-Recorded Webinar
Register to access this free online video webinar which covers this topic in-depth.
for Cell Growth
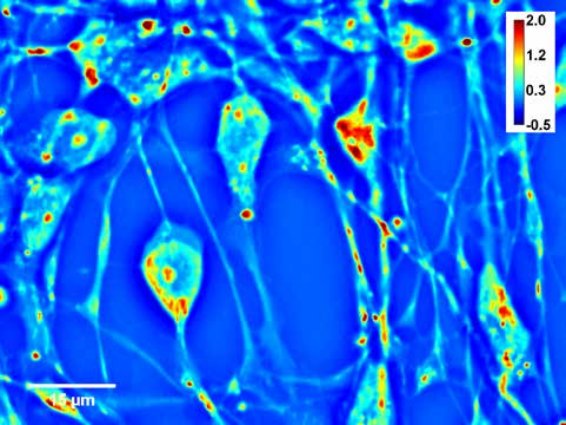
CellVista SLIM is a non-invasive phase imaging technology that quantifies the physical properties of live cells and tissues. The output is a live quantitative image (SLIM map) of the specimen. The intensity of every pixel in the frame is a measure of a phase shift map (in radians) or the optical path length difference (in nanometers) through the sample, which is measured with sensitivity better than 0.5 nanometers [1]. As shown in Figure 1, the phase shift map is converted on-the-fly to other SLIM maps, with their respective pixel intensity: thickness (in microns), dry mass area density (picograms per square micron) and refractive index. More detailed description of SLIM can be found in the reference pages in the How It Works page of this website.
.
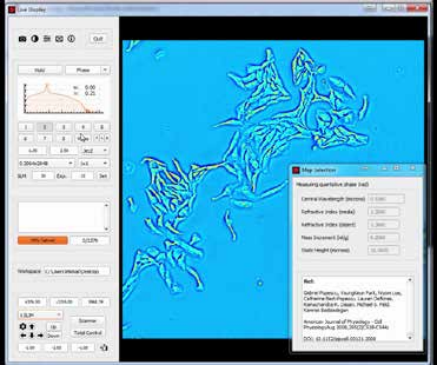
Figure 1. CellVista SLIM Software captures cells with nanometer sensitivity.
The measured path length information at each pixel is directly related to the dry mass density at that point, and, thus, by integrating over a Region of Interest (ROI), the total dry mass in the ROI is measured. See Figure 2.
When translated into dry mass, SLIM’s sensitivity corresponds to changes on the order of femtograms [2]. To analyze the data from the growth/2proliferation assay Phi Optics provides a set of plugins based on the NIH ImageJ for image post-processing; the analysis can be done on any of the two types of acquired SLIM maps.
Steps to Extract Cell Dry Mass:
- Load SLIM images maps into ImageJ.
- Select ROI using freehand or auto segmentation tool.
- Select the dry mass plugin from the 2D analysis menu.
- The total dry mass in each ROI will be displayed in a separate column.
- Output can be saved in Excel or CSV for further analysis or machine learning algorithms.
CellVista SLIM was used to measure the dry mass of individual E-coli cells as shown in Figure 3. The measurements were performed simultaneously on many individual cells and relevant statistics were acquired on large populations.
CellVista SLIM measurements of E. coli growth: (A) Dry mass vs. time for a cell family. Growth curves for each cell are indicated by the colored circles on the images. Images show single cell dry mass density maps at the indicated time points (in minutes). (Scale bar: 2 um.) The blue line is a fixed cell measurement, with SD of 19.6 fg. Markers indicate raw data, and solid lines indicate averaged data. (B) Growth rate vs. mass of 20 cells measured in the same manner. Faint circles indicate single data points from individual cell growth curves, dark squares show the average, and the dashed line is a linear fit through the averaged data; the slope of this line, 0.011 min-1, is a measure of the average growth constant for this population. The linear relationship between the growth rate and mass indicates that, on average, E. coli cells exhibit exponential growth behavior [2].
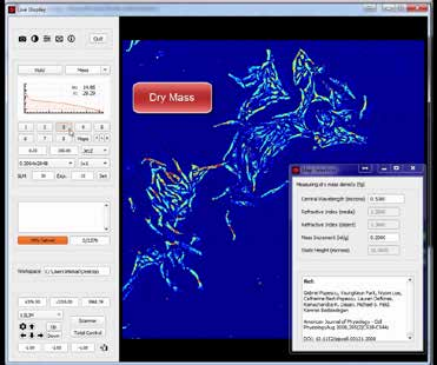
Figure 2. CellVista SLIM captures dry mass (protein content) by
measuring the optical path length for each pixel.
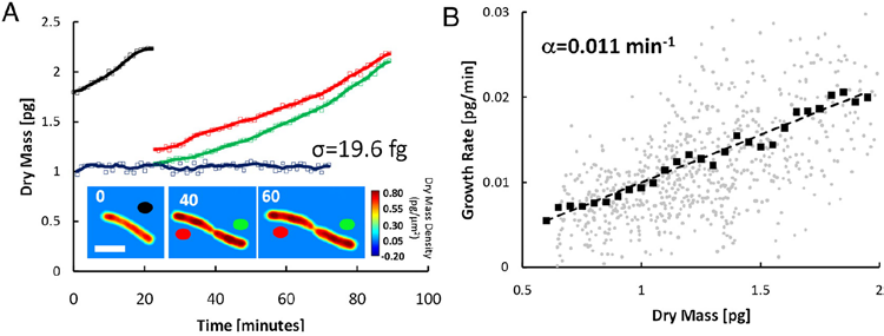
Figure 3. CellVista SLIM measures dry mass over time.
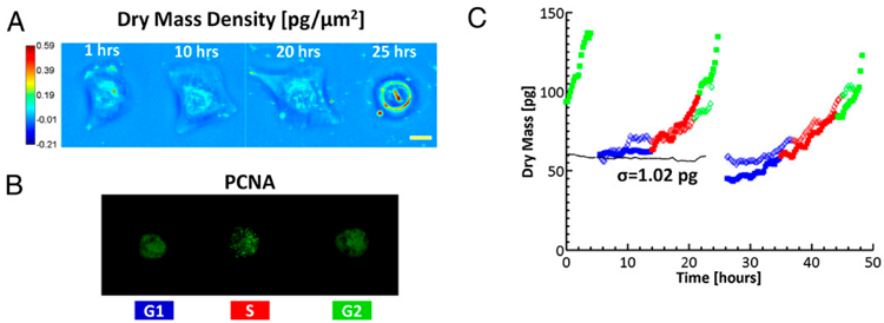
Figure 4. CellVista SLIM measurement of U2OS growth over 2 days.
Simultaneous CellVista SLIM and Fluorescence Imaging
To study single cell growth in an asynchronous culture and obtain information about cell cycle-dependent growth, CellVista SLIM was combined with epi-fluorescence imaging (Figure 4) [2].
While CellVista SLIM measures the dry mass at each point in time, the fluorescence markers indicated the phase of the cell within the cell-cycle. CellVista SLIM shares the same optical path with all of the other channels of the microscope, enabling seamless overlay of all normal microscope modalities.
The one-to-one correspondence between the cells in CellVista SLIM images and the cells in fluorescence images enables cycle-dependent growth measurements.
Dry mass density maps (A) of a single U2OS cell over its entire cycle at the times indicated. (Scale bar: 25 um.) Color bar indicates dry mass density in pg/um2.(B) Simultaneously acquired GFP fluorescence images indicating PCNA activity; the distinct GFP signal during S phase and the morphological changes during mitosis allow for determination of the cell cycle phase. (C) Dry mass vs. time for a cell family (i.e., 1->2->4 cells). The two different daughter cell lineages are differentiated by the filled and open markers; only one daughter cell from each parent is shown for clarity. Different colors indicate the cell cycle as reported by the GFP-PCNA fluorescence. The dotted black line shows measurements from a fixed cell, which has SD of 1.02 pg [2].
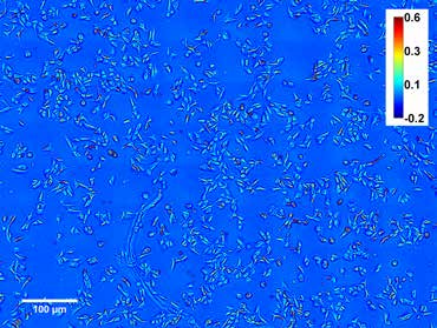
Figure 5. U-2 OS Cell Population Day 1
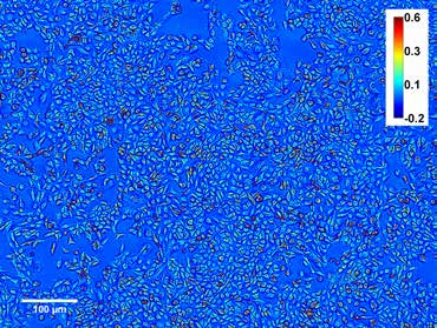
Figure 6. U-2OS cell culture over more than 2 days.
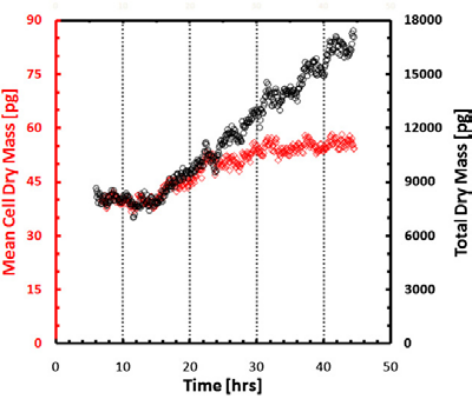
Figure 7. Mean dry mass and total dry mass over time.
Measurement of growth in large populations. Black shows dry mass vs. time for a synchronized cell population over a 3.2 × 2.4 sq. millimeters field of view obtained by montaging 8 × 8 microscope images. (10× objective, NA = 0.3). Red shows cell mean dry mass vs. time. Images show the field of view at 4 (left) and 45 h (right). Color bar is in radians (phase shift) [2]. Because of the large resolution of SLIM frames (e.g. 4 megapixels), large cell populations can be studied. SLIM was tested in cell growth measurements of mammalian cells over more than one cell cycle as shown in Figures 5 & 6 [2]. The results in Figure 7 show that the mean cell mass evolves synchronously in time with the total mass of the entire population during the duration of a (mean) cell cycle, i.e., 22–26 h, after which it levels off. This finding indicates that after one cell cycle, the culture loses synchrony and the single cell mass is limited by mitosis.
In Conclusion. We establish that label-free proliferation assays can be obtained with CellVista SLIM, providing advancements with respect to existing methods for quantifying cell growth: (i) CellVista SLIM can perform parallel growth measurements on an ensemble of individual cells simultaneously; (ii) Spatial and temporal correlations, such as cell–cell interactions, can be explored on large scales; (iii) In combination with fluorescence, specific chemical processes may be probed simultaneously; (iv) the environment is fully biocompatible and identical to widely used equipment; (v) CellVista SLIM offers the ability to directly monitor cells and their surroundings, elucidating the nature of any artifacts and providing morphological information simultaneously; (vi) A lineage study is possible, i.e., a cell and its progeny may be followed; and, (vii) Measurements can be performed on cells ranging from bacteria to mammalian cells.
For high image resolution solutions of thick specimens, please see our CellVista GLIM™ systems. For customization don’t hesitate to CONTACT US!
References:
[1] G. Popescu (2011) Quantitative phase imaging of cells and tissues (McGraw-Hill, New York) p. 313.
[2] M. Mir, Z. Wang, Z. Shen, M. Bednarz, R. Bashir, I. Golding, S. Prasanth and G.Popescu, Optical Measurement of cycle-dependent growth , Proc. Natl. Acad. Sci., 108 (32), 13124 (2011).
[3] M. Mir, T. Kim, A. Majumder, M. Xiang, R. Wang, S. C. Liu, M. U. Gillette, S. Stice and G. Popescu, Label-free characterization of emerging human neuronal networks, Scientific Reports, 4, 4434 (2014).
[4] M. Mir, A. Bergamaschi, B. S. Katzenellenbogen and G. Popescu, Highly sensitive quantitative imaging for monitoring single cancer cell growth kinetics and drug response, PLoS ONE, 9 (2), e89000 (2014).